Using Bloom for Alert Triage
At the moment, Neo4j Bloom can be used to perform basic on-call triage tasks, though its functionality will be expanding in the future according to user feedback.
In it's current state, Hyperion ingests all Hive alerts and attempts to extract observables from them, allowing for faster and more informed triage process by:
- Giving the analyst the ability to instantly fetch contextual information for alert observables, including other alerts related to the observable, or internal telemetry associated with it
- For example: when dealing with a suspicious logon attempt alert, an analyst will immediately see if a Host has been seen with that IP, as well as any other logon attempts, Zoom meetings and threat reports associated with the IP
- Providing an easy way of enriching and observable with further context from external APIs such as pDNS, VirusTotal
- In case an alert fired for multiple instance of the same False Positive event, multiple alerts can be marked as Read without needing to click through each one to ensure they related.
At the moment, not all observables are ingested into Hyperion, since many have their Type set to other which makes parsing them challenging. So while we figure out how to deal with those observable types, they are being ignored from the ingest.
Triage Steps
Open Neo4j Bloom
In order to be able to perform triage in Hyperion, you need to make sure you have correctly configured your Neo4j Bloom app. Check out this guide for help with setting up Bloom.
Fetch unread alerts
Bloom has a pre-made query called Show me unread Hive alerts. When executed, all unread alerts will be displayed and their observables will be automatically expanded.
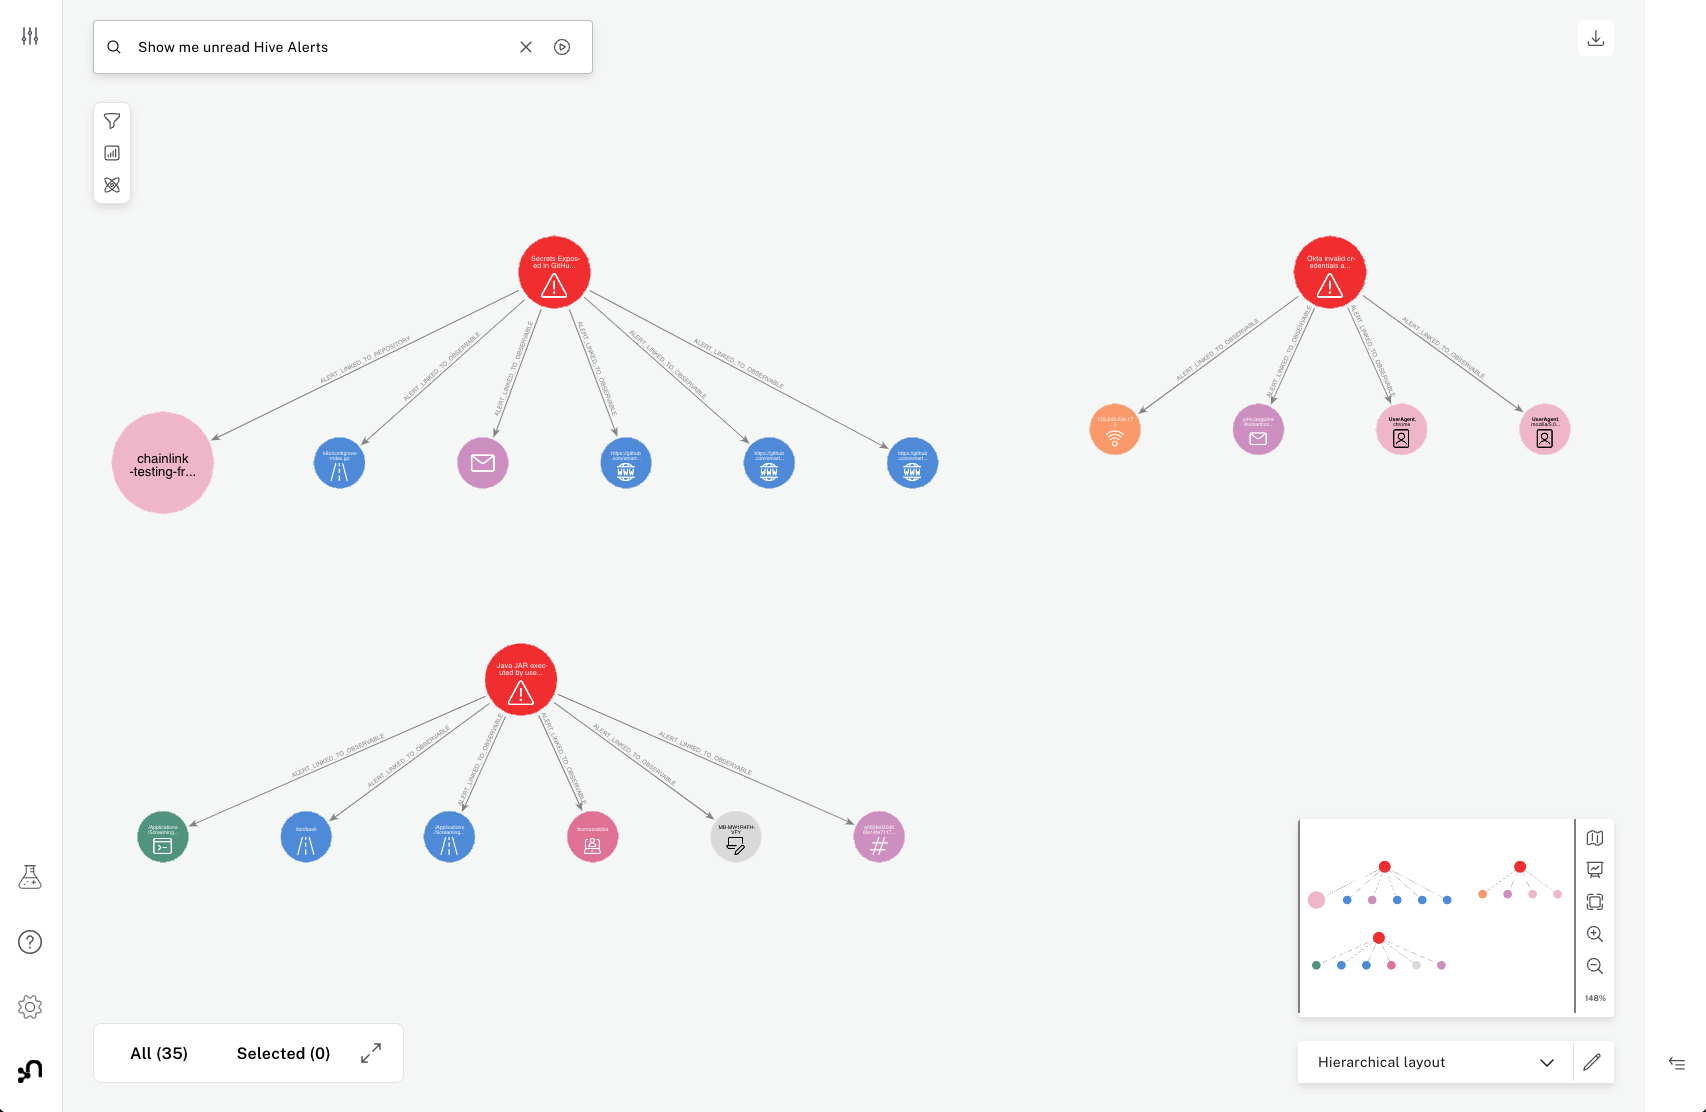
In this instance, we have 4 unread alerts, which do not seem related to each other. As a tutorial, let's focus on the Okta alert.
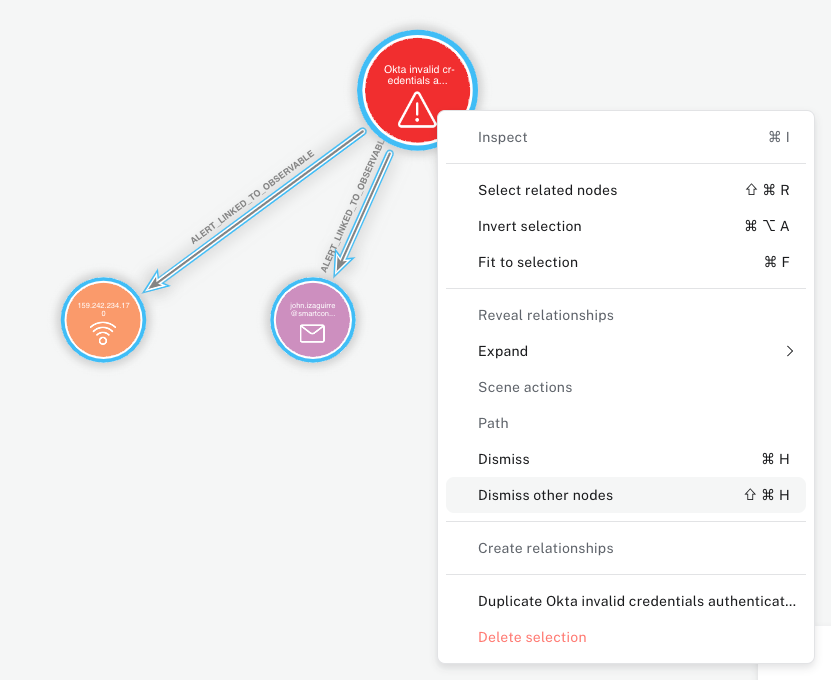
When we zoom into the alert, we can see its related to failed logon attempts related to an IP address that hasn't been seen before. In order to focus on this alert specifically, lets dismiss all the other alerts for now by click on any node that is part of this cluster, and then Selecting related nodes followed up by Dismiss other nodes:
Now that we only see this alert, we can begin to pull in additional data related to this event. First up, lets try to better understand what this IP is by expanding its relationships.
We can do this by clicking on the node and using Expand to bring all information about it. While we're at it, we will also expand the resulting LogonAttempts node that appear.
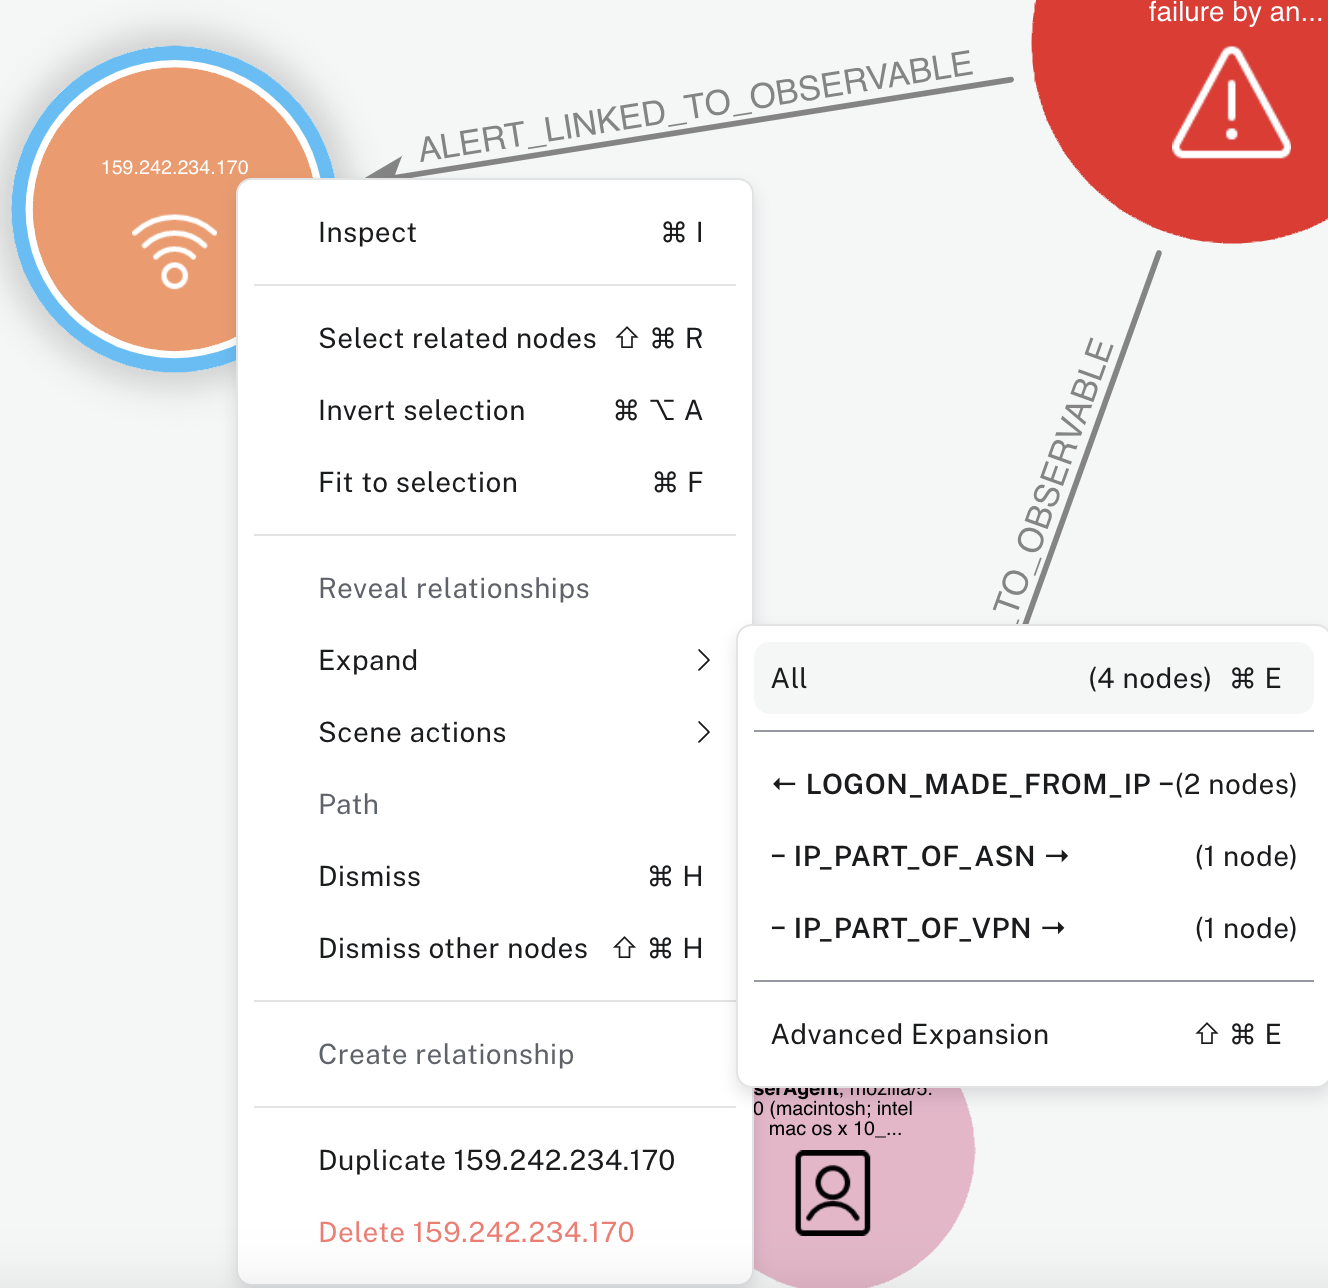
This shows us the IP is a Hide My Ass VPN and that it's related to 2 failed logon attempts, both for the same account. When we pivot into other logons from that account, we also discover they had used this VPN before,
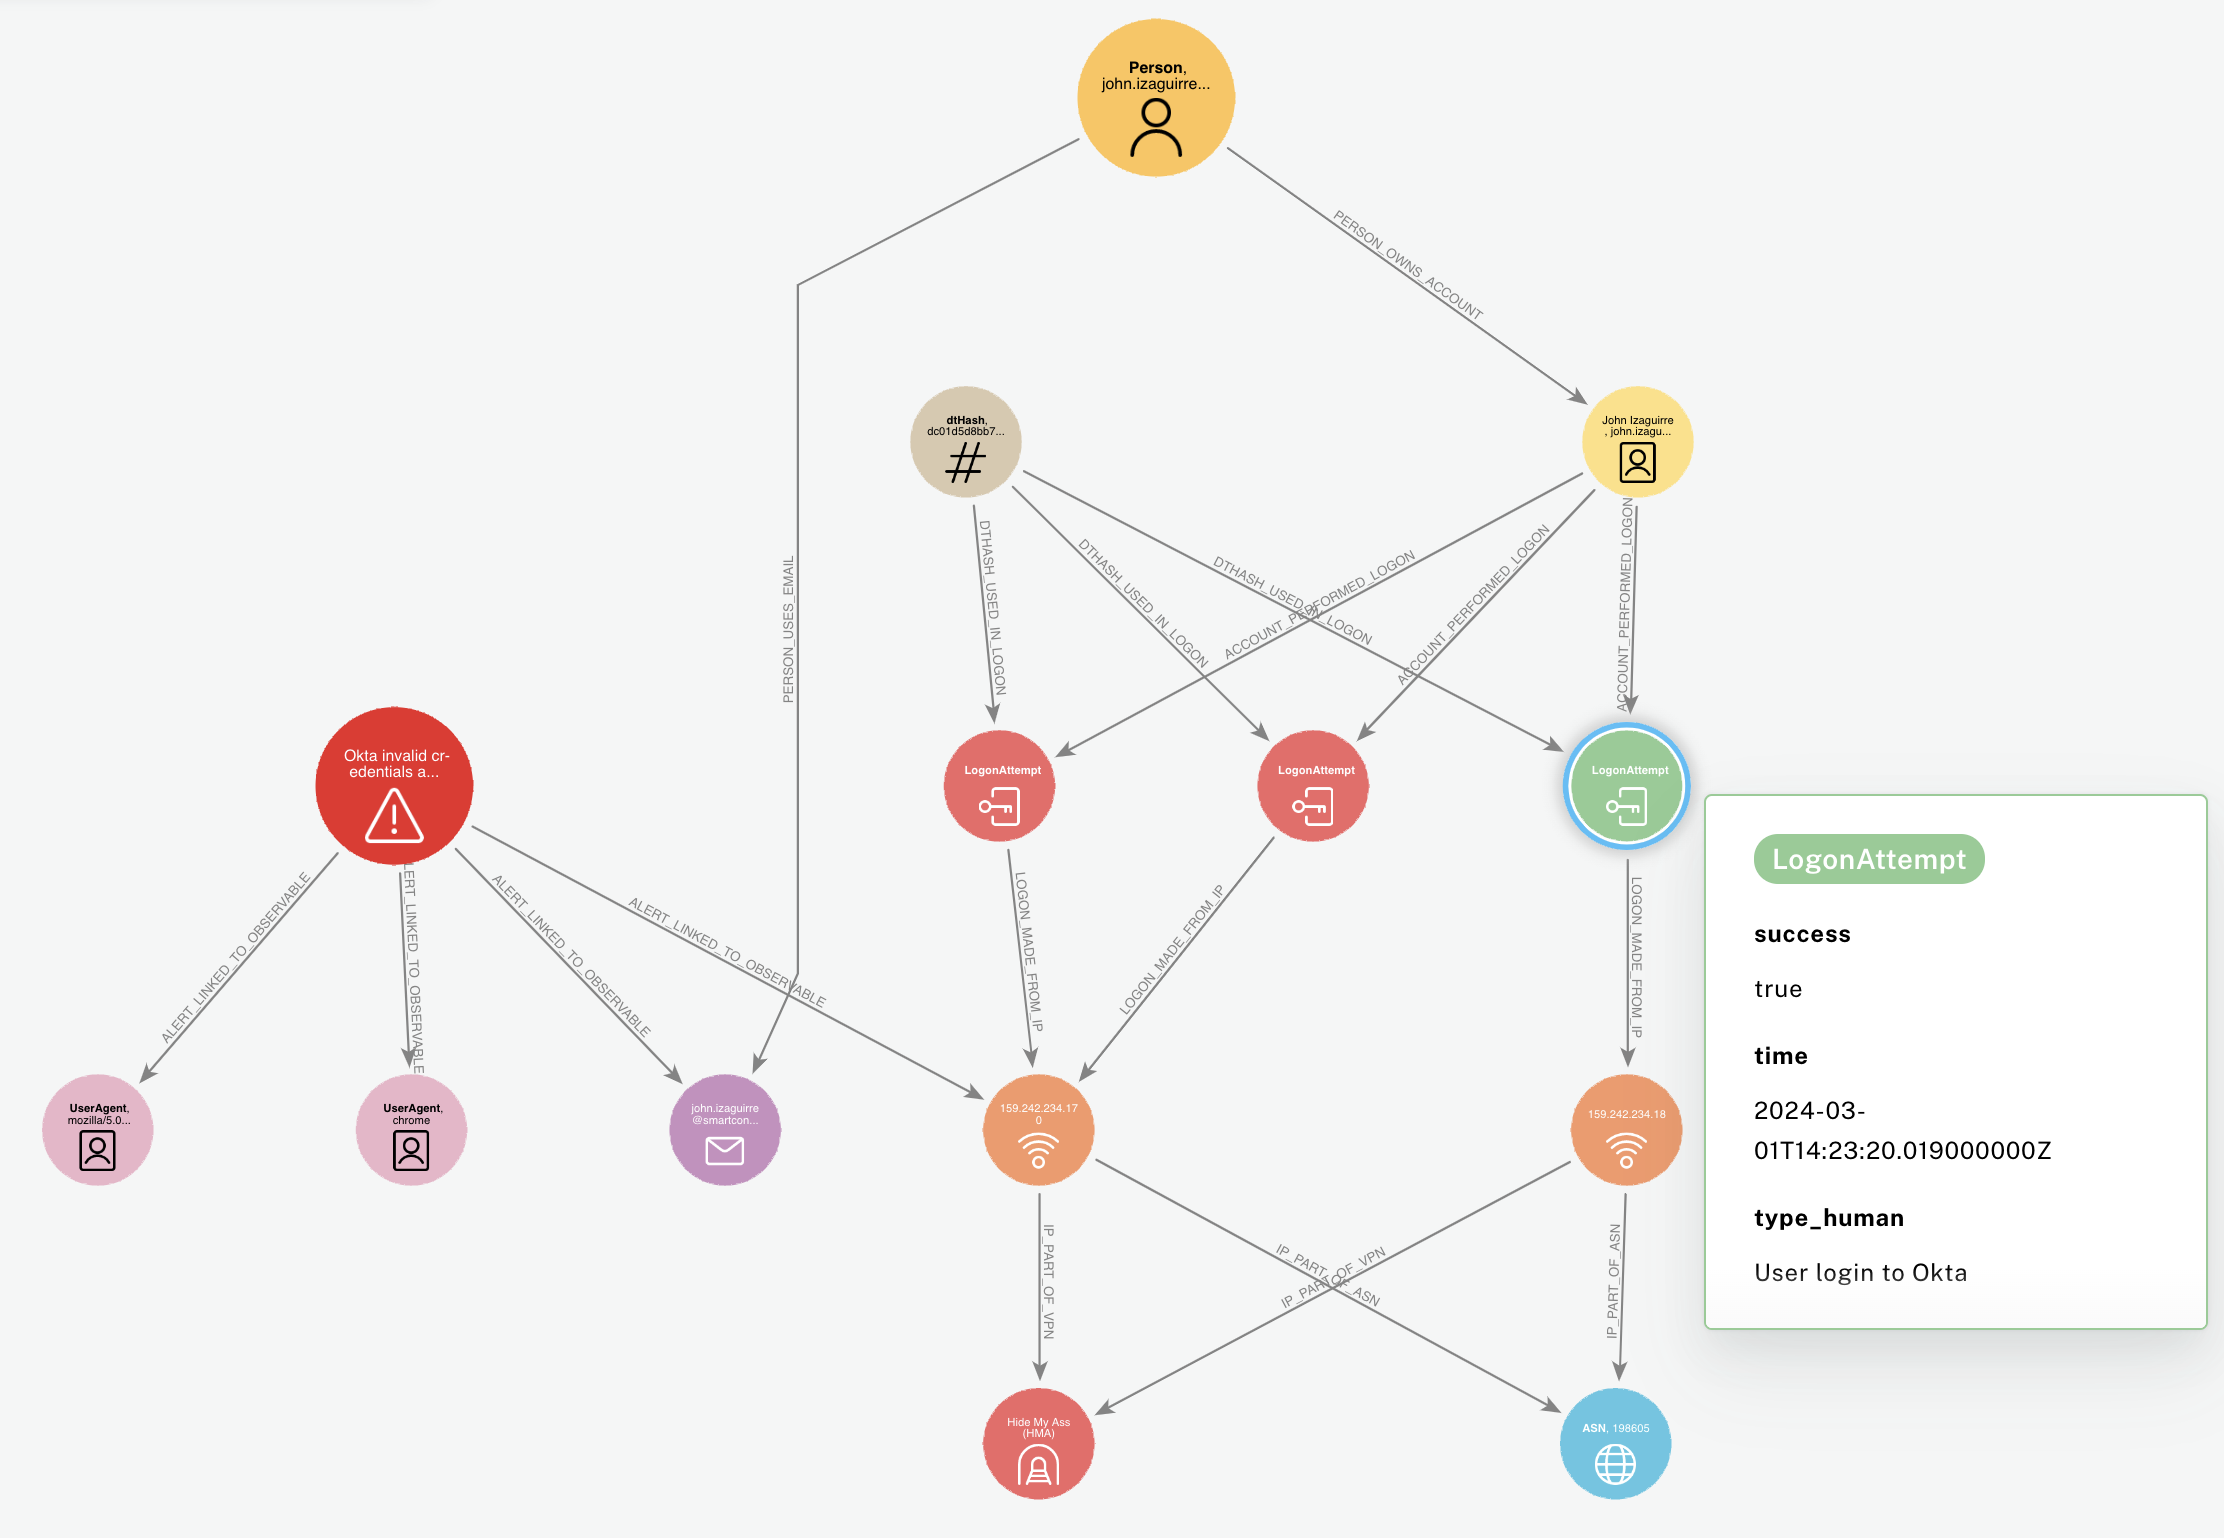
We can then dive deeper into the user involved in those logons, pivot into their historical logons to determine if they commonly use Hide My Ass VPN, or if their host was seen with the same IP at the time of the failed logon attempts - although in this case unfortunetely this person was a consulant who did not use a managed laptop.
Other examples
Using Bloom to quickly identify related alerts
As mentioned in the tutorial above, sometimes alerts will be either related to one another, or will be just multiple instances of the same alert.
Remember - you can select multiple nodes and run actions on them at the same time. This means if you have 3 alerts you can confidently say are linked, you can close them down in 2 clicks, rather than having to click through every alert separately. This is especially useful when doing triage after "waking up" where the queue might have 20+ alerts and not all related alerts are listed on after the other.
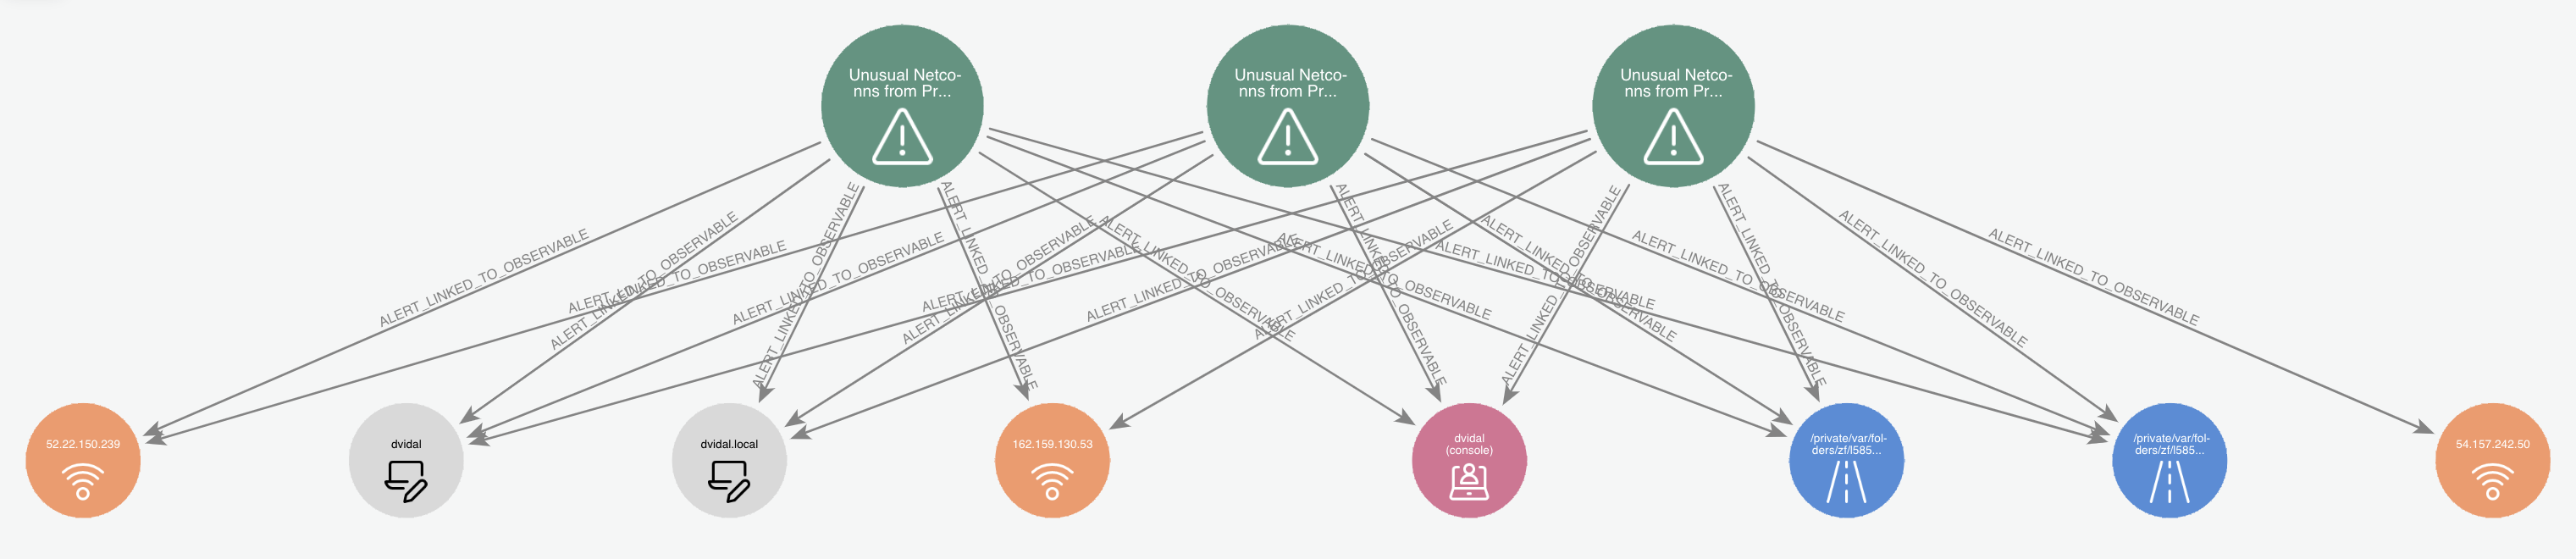
For example here we see multiple alerts related to the same activity from our resident Splunkmaster Vidal:
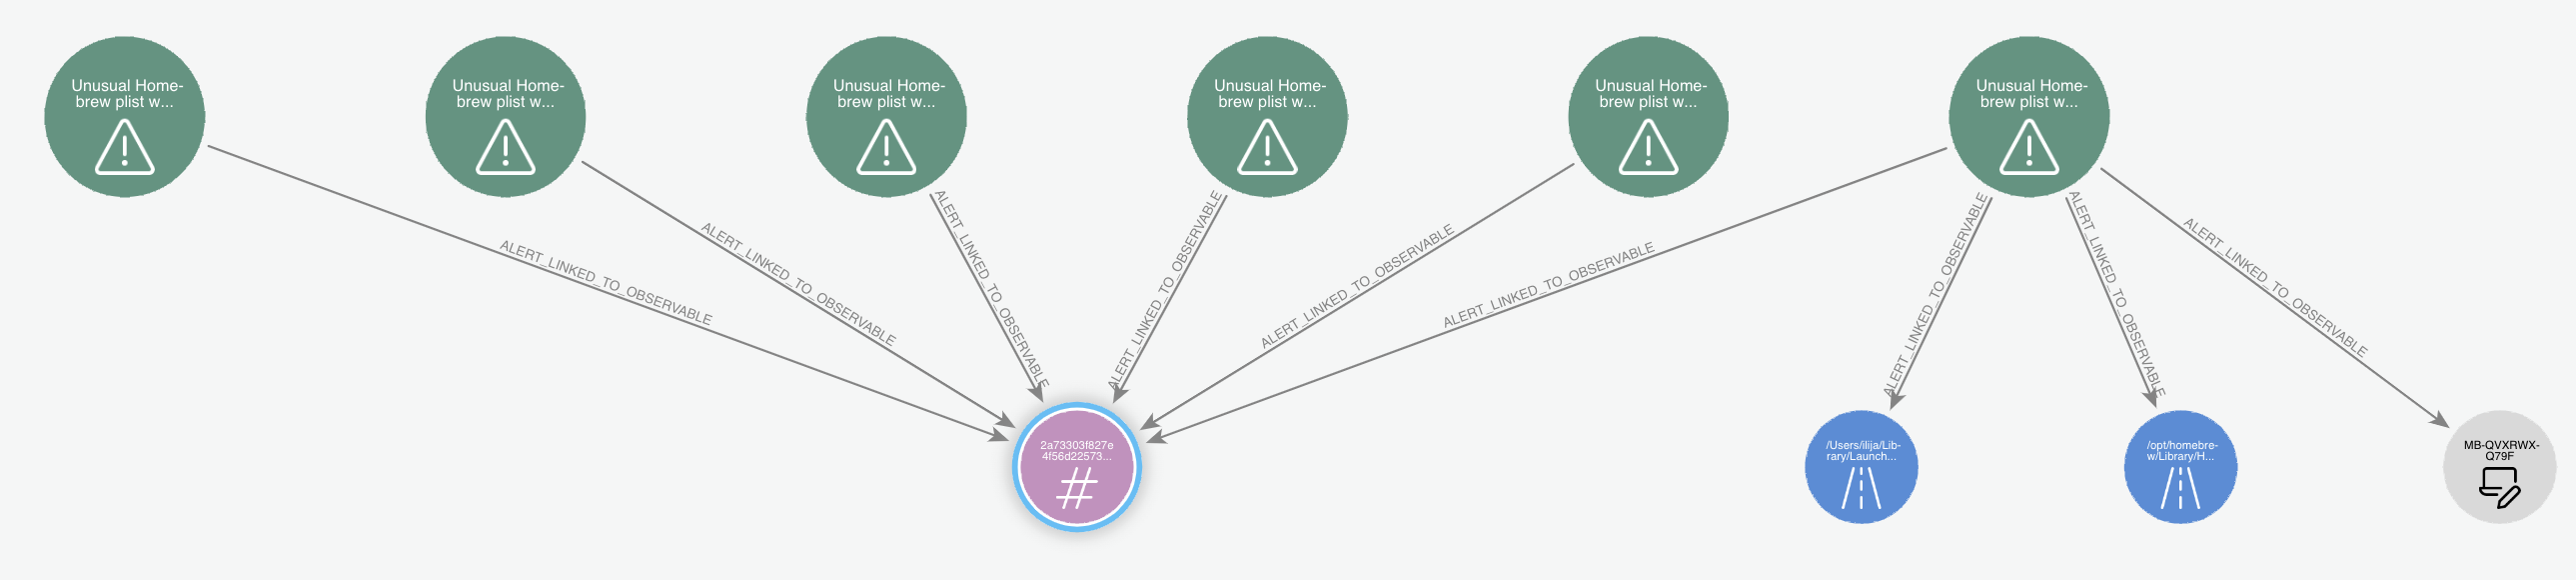
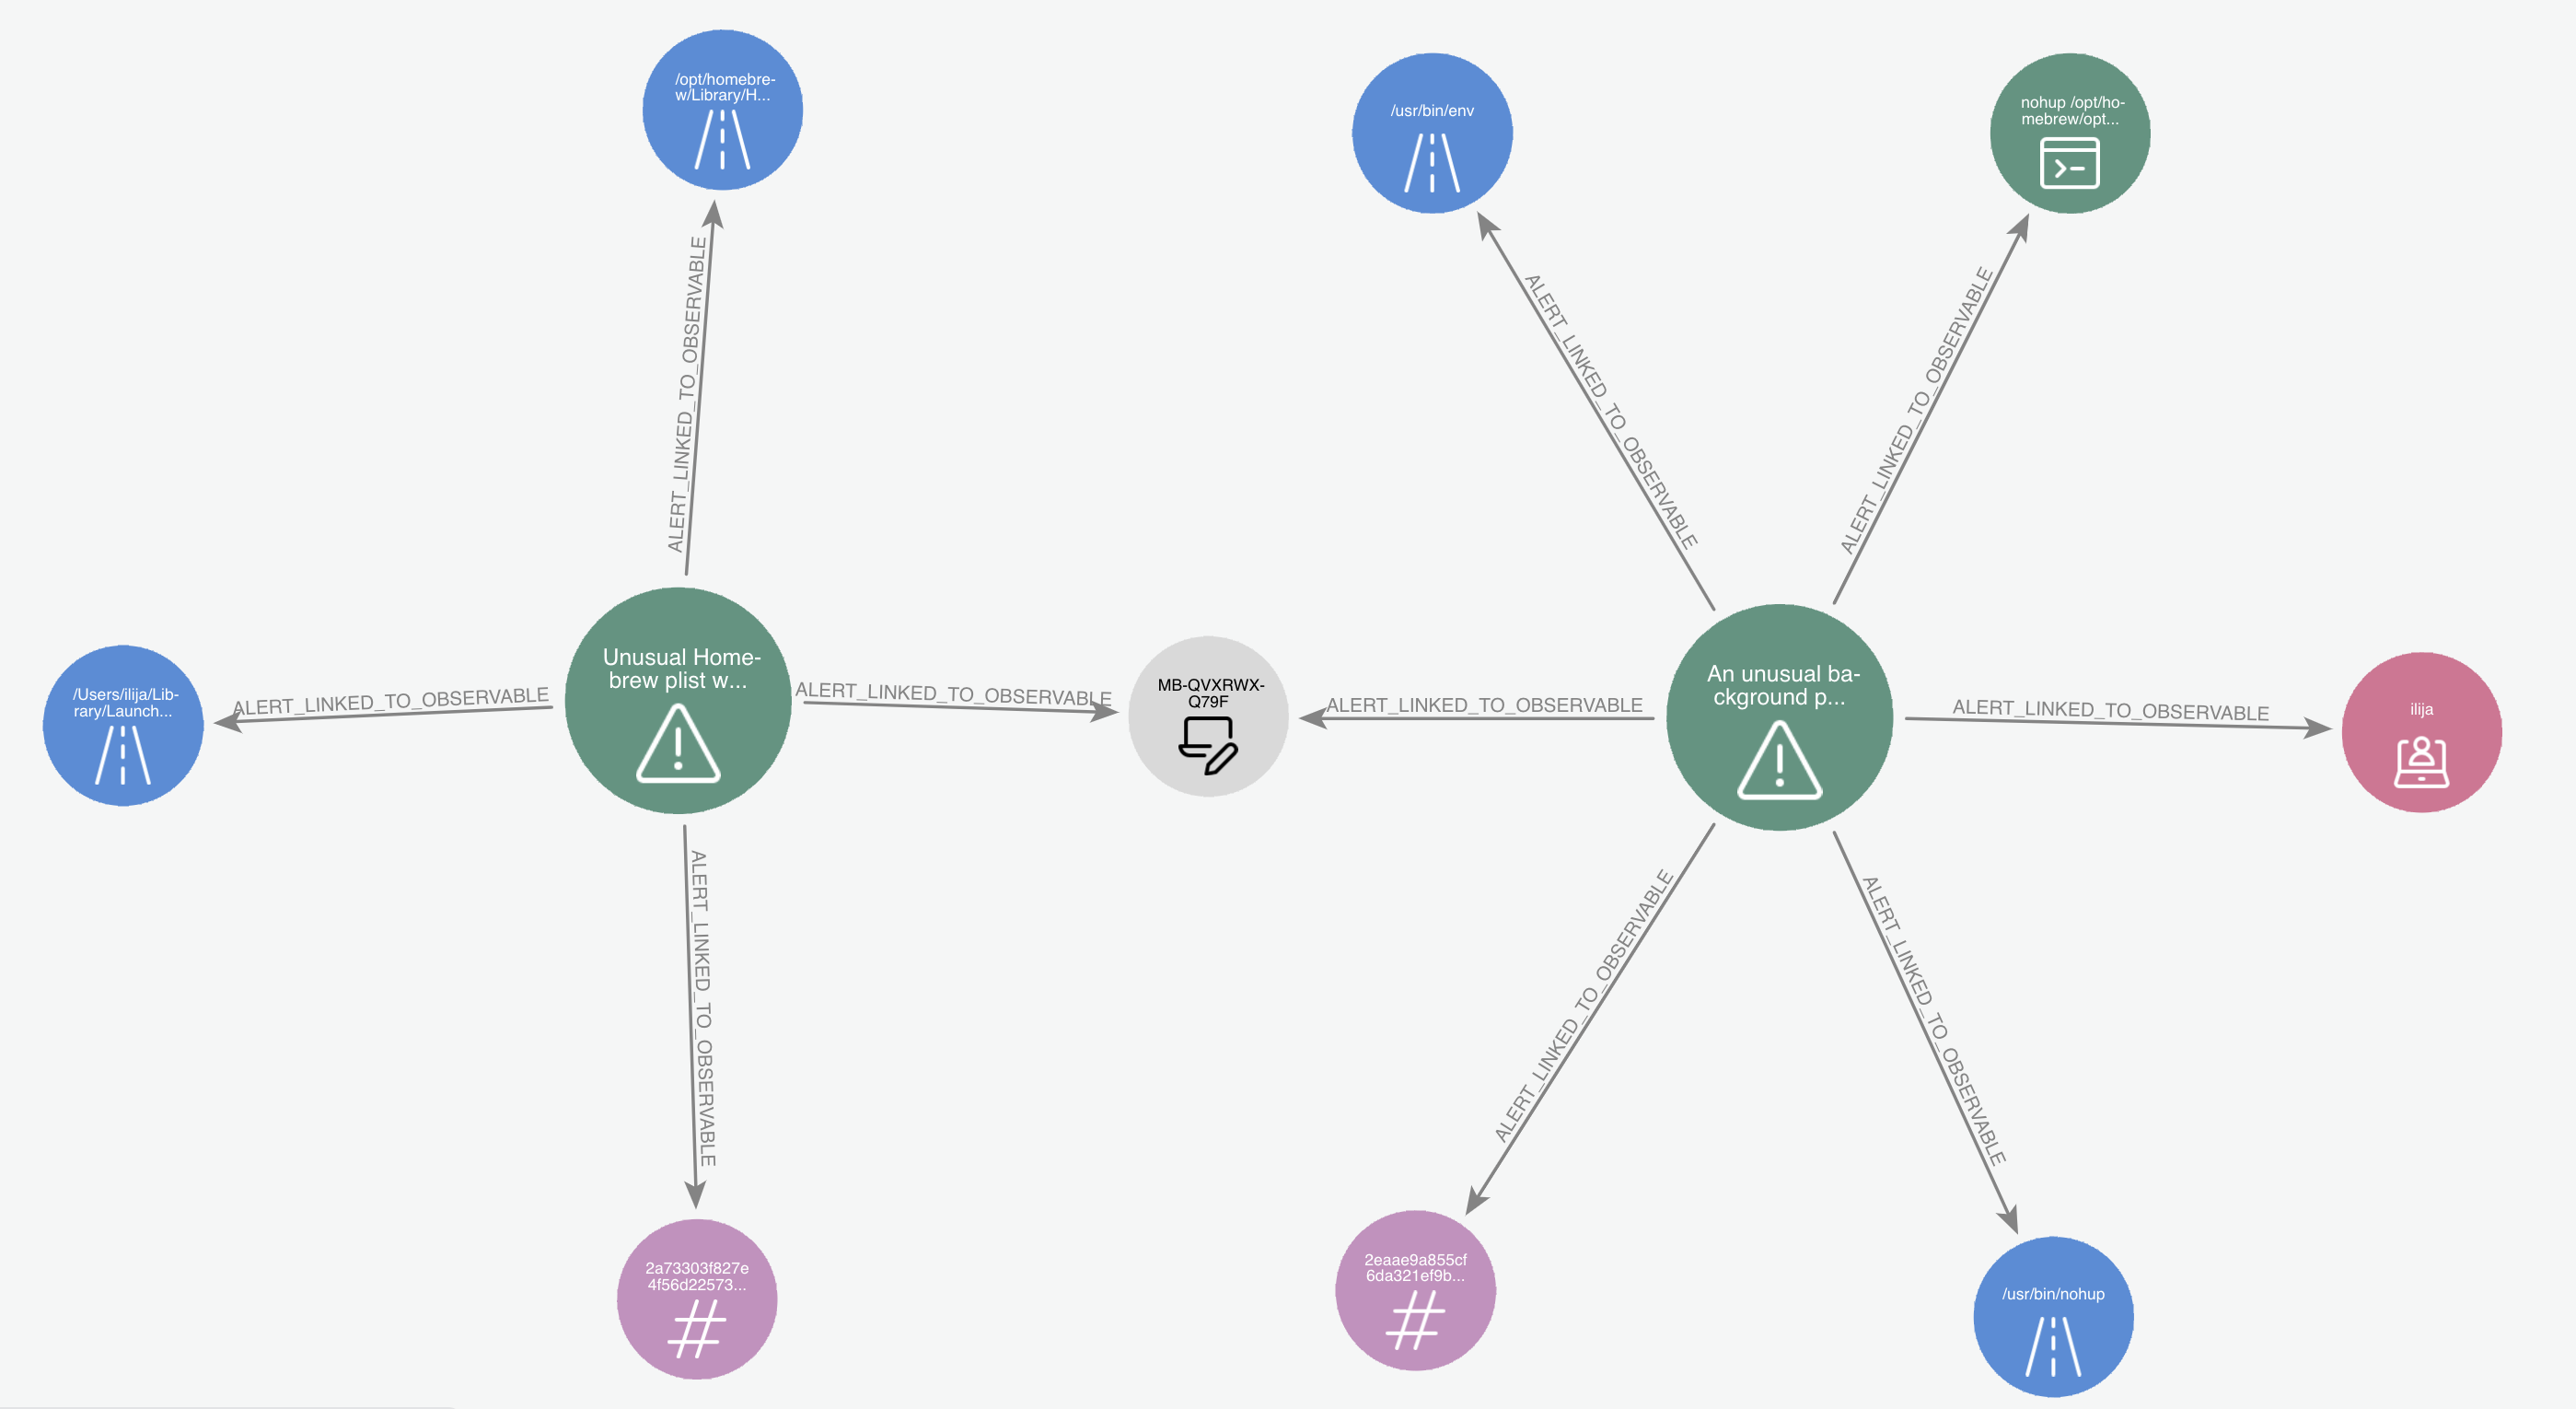
Whereas here we can quickly see these 2 alerts are both related to the same host, and upon quick review of the filepaths involved can also determine they stem from the same app being installed via Homebrew:
Using Bloom to discover historical alerts related to an observable
Since Hyperion stores relationships close to identifintely, you can quickly discover if an observable has been seen in an alert before. For example, when dealing with an alert related to a hash, you can expand its relationships:
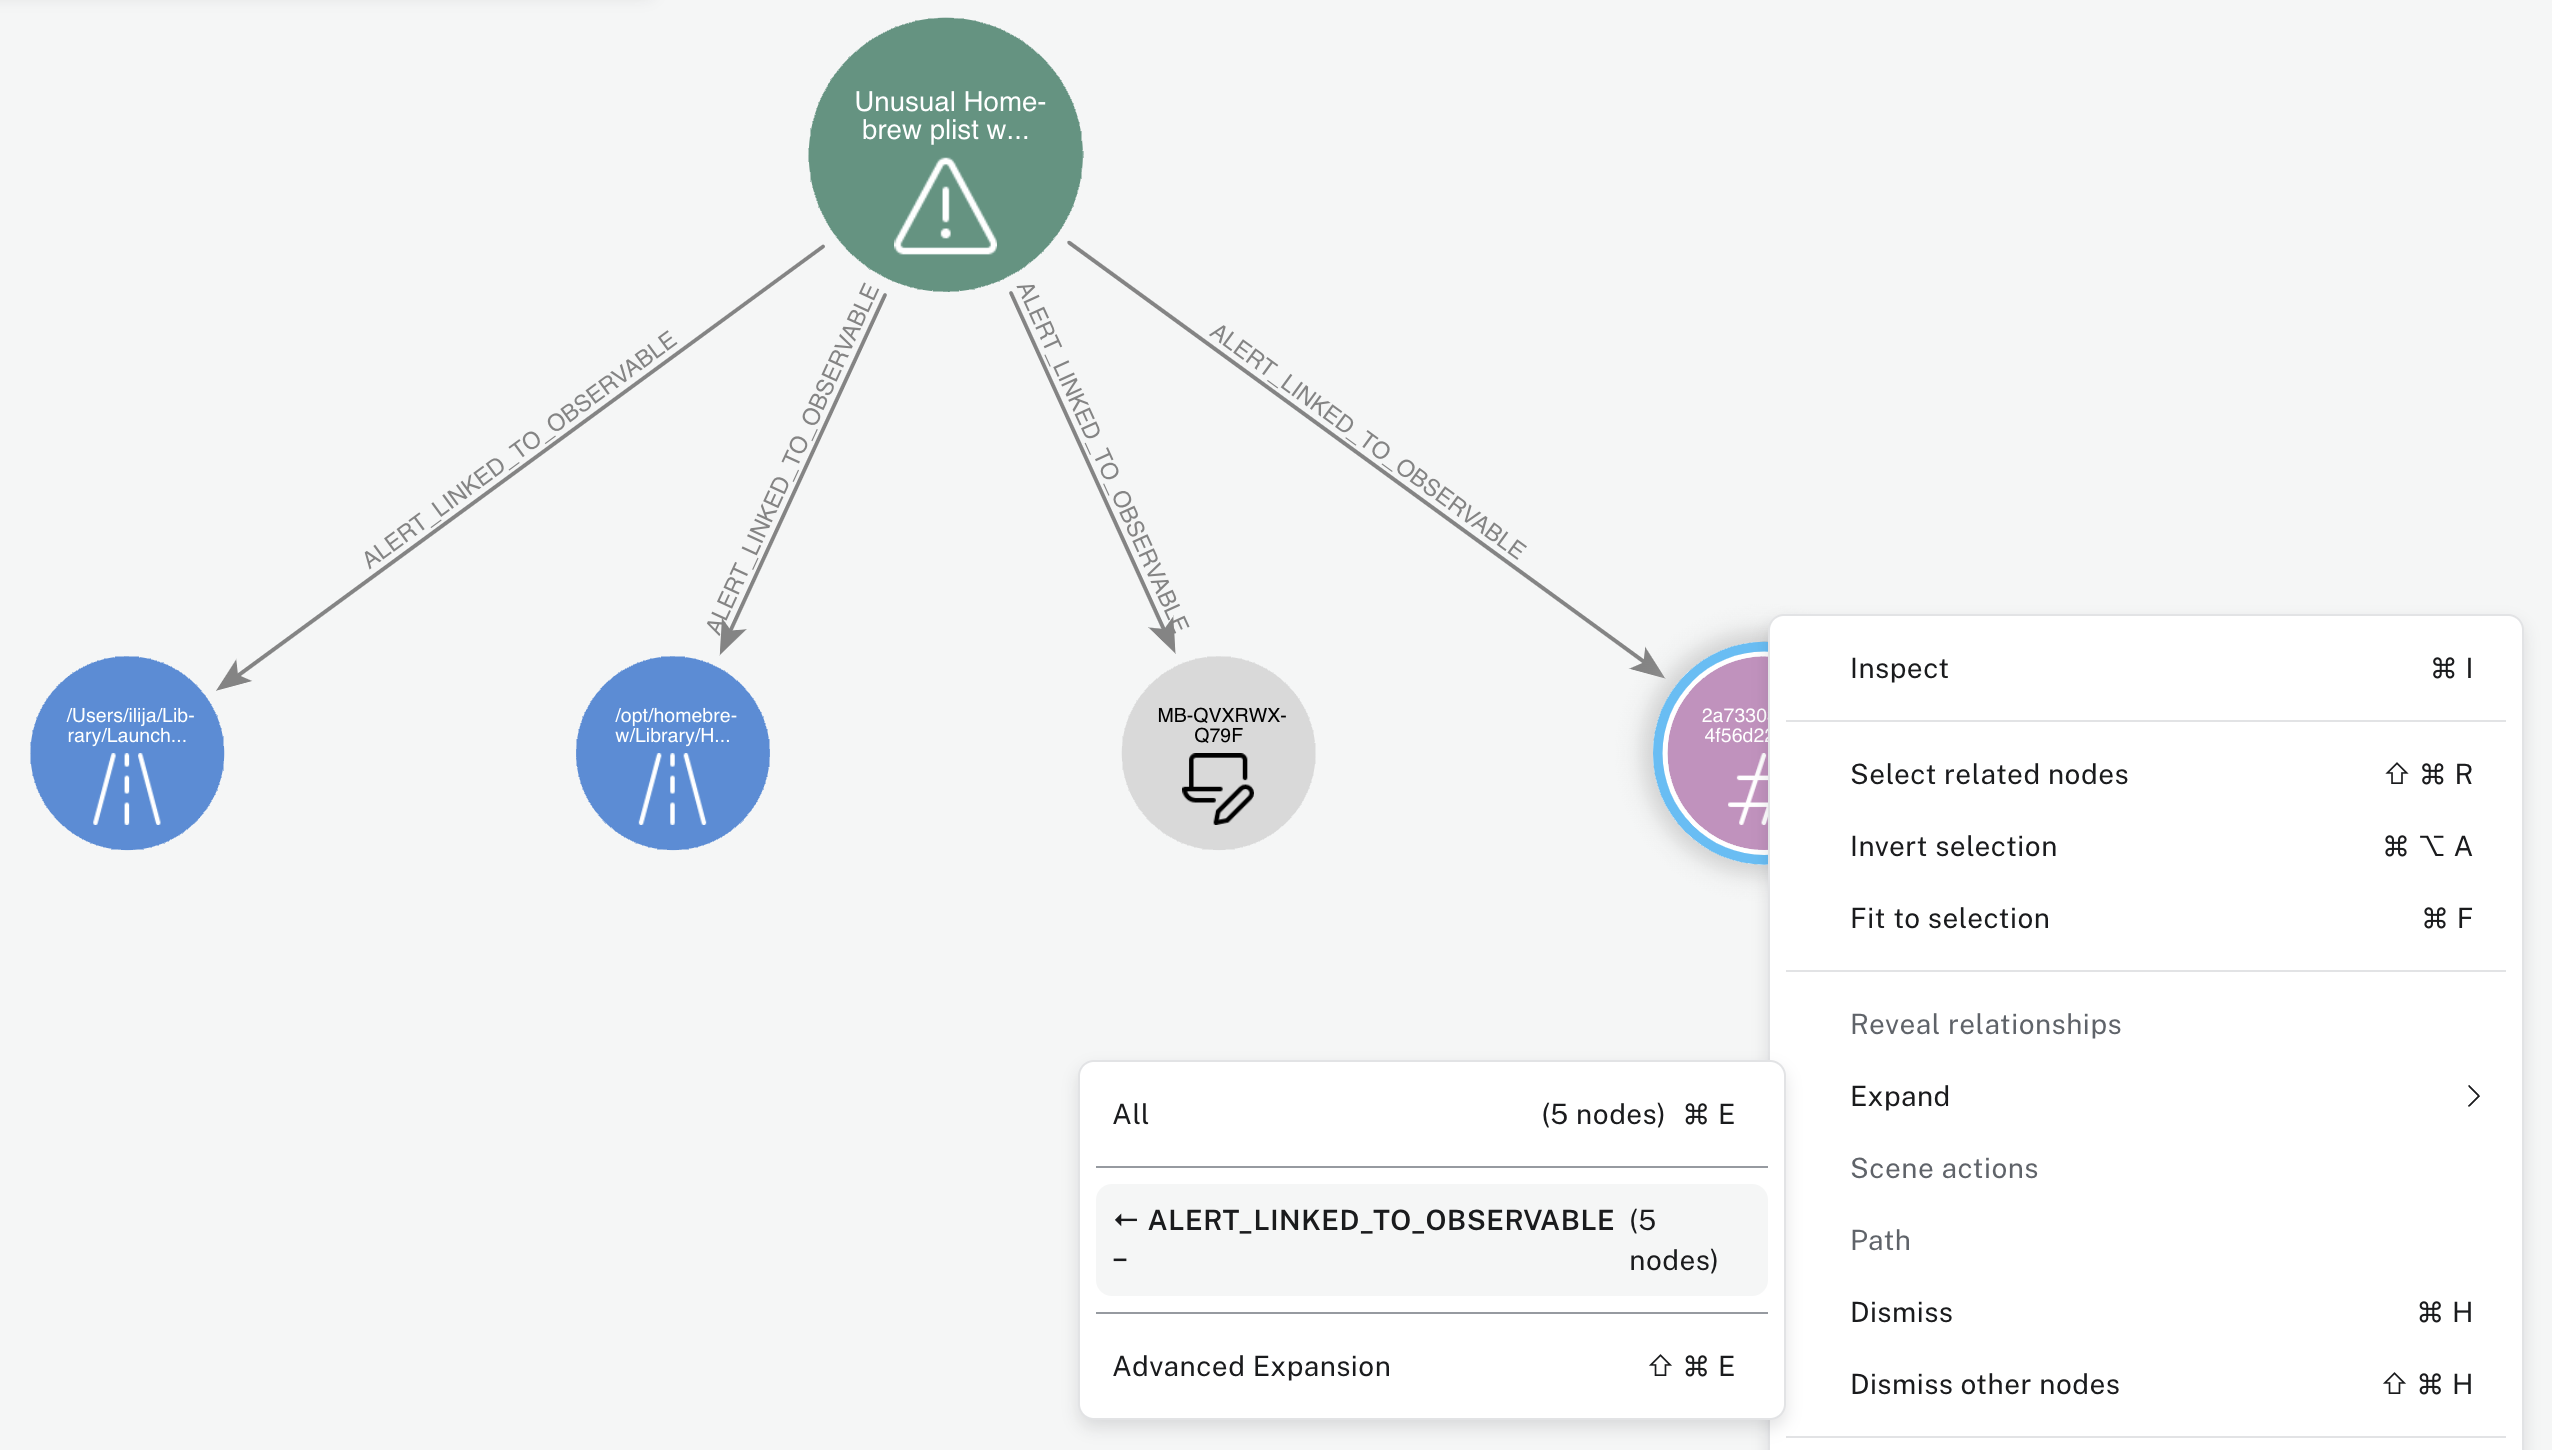
And quickly see this particular file causes a lot of False Positives (which is hardly surprising as this is the Ruby binary)