Hyperion Reliability Monitoring
Service reliability
All Hyperion services are being monitored by Netdata, which is running as a Docker container managed by Portainer from this compose file. Netdata collects telemetry from both the physical host as well as the running Docker containers. At the moment, we do not have any custom alerts and rely in the alerts built into Netdata.
Netdata exposes a single port 19999 which is then routed via Cloudflare ZT to metrics.oobtel.network. This service connects directly to the agent on the server and only requires authentication to Cloudflare ZT.
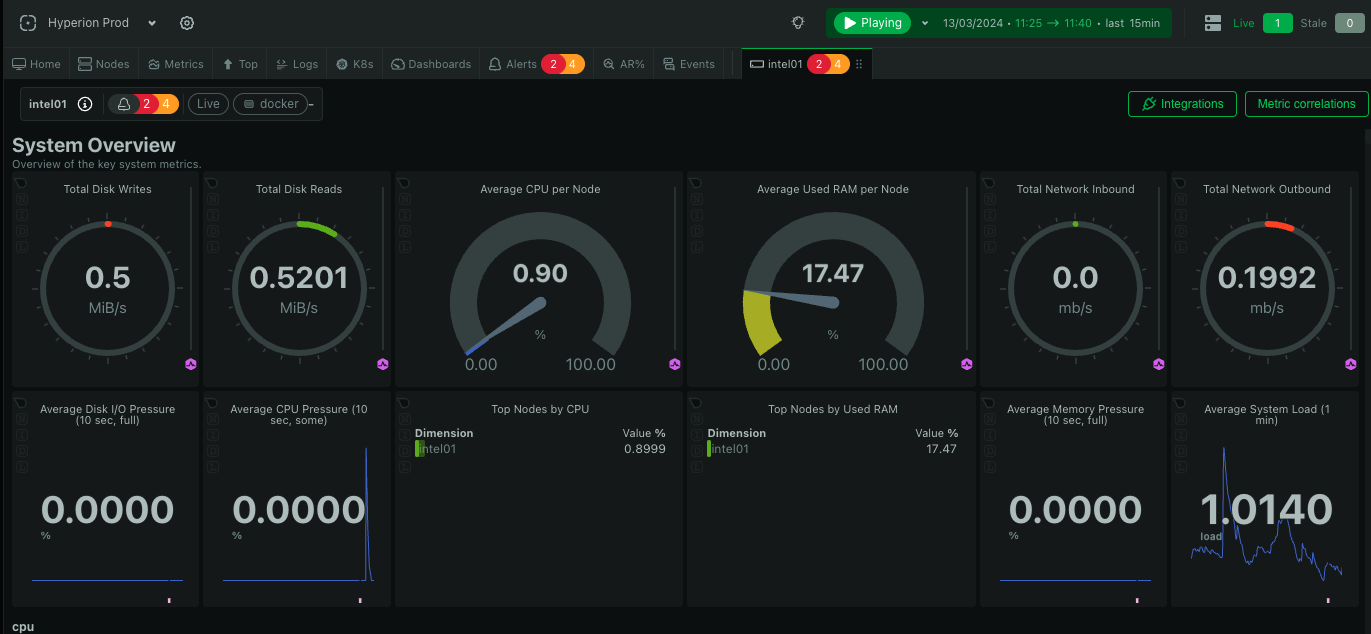
In the event that the intel01 server is unreachable, Netdata will send email alerts and this dashboard can be accessed using the Cloud UI - you need to have an account to access it. Currently Bartosz R. and Myles R. have access to this dashboard. This is useful as it allows to see the host telemetry from before the issue occured making troubleshooting just a little bit easier.
Critical alerts via PagerDuty
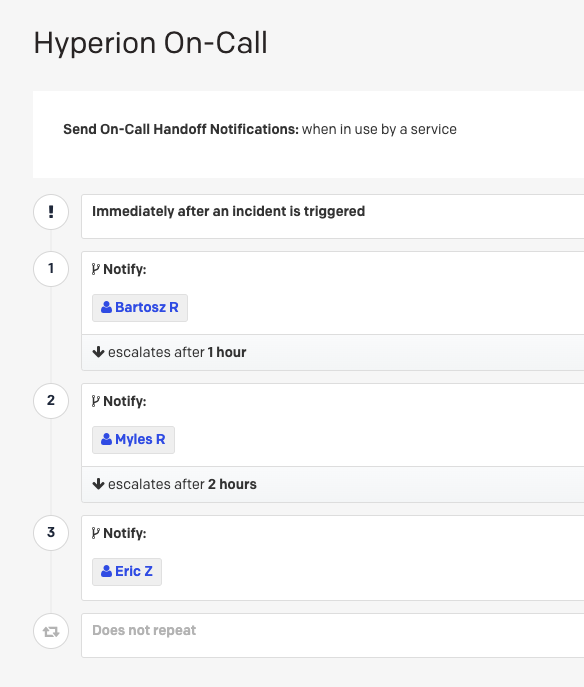
Netdata agent is configured with an Out-of-Band PagerDuty account which is used for alerting on High/Critical issues. Hyperion uses a Freemium tier of PagerDuty, which allows to define a single escalation policy/on call-routine, currently set as follows:
- L1 - Bartosz R. - notified immediately
- L2 - Myles R. - escalates after 1 hour
- L3 - Eric Z. - escalates after 2 hours
In order to remove common false positives, the Netdata agent was also slightly tweaked to be less aggressive for ECC memory related issues - the default setting creates a Critical alert when there's >0 ECC errors or >0MB corrupted memory. We've tweaked this a little to look for >50 errors and >0.5MB corrupted memory.
Netdata custom settings
Netdata was configured with 2 custom Prometheus metrics endpoints for monitoring:
- Neo4j
- Tyk API Gateway
These config changes were appended to the Netdata Prometheus config here:
/mnt/truenas/netdata/config/go.d/prometheus.conf
<rest of the config>
- name: neo4j_local
  url: 'http://10.10.10.196:9009/metrics'
- name: tyk_gateway_local
  url: 'http://10.10.10.196:8084/metrics'
Data Pipeline reliability
Windmill ETL Workflows
The Hyperion Data Pipeline has its own set of reliability monitoring features, which is implemented as an Windmill Error Handler - whenever an ETL pipeline in Windmill fails, it will trigger an alert into the #sec-hyperion-alerts Slack channel.
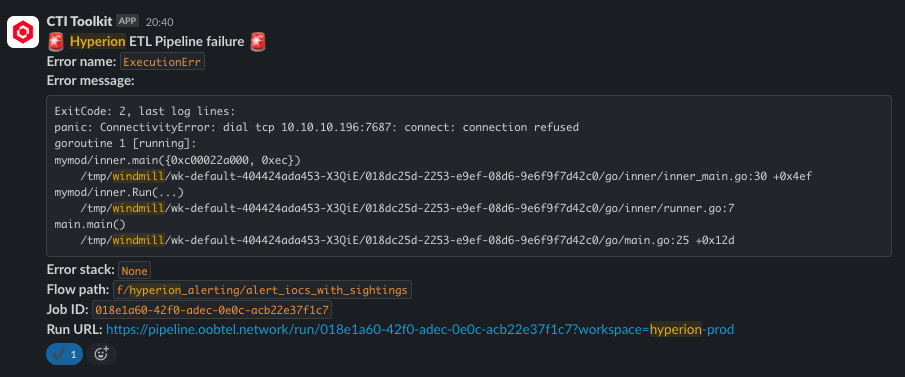
To learn more about how to use Error Handlers in Windmill, see Windmill guidelines docs. Additionally, logs for all Windmill flow executions can be found here. The retention on these is set to 30 days.
[WIP] Data ingest alerts
In addition to failed ETL workflow monitoring, Hyperion has the following periodic rules which will trigger alerts whenever the data ingested goes outside of the expected threshold:
- No new
LogonAttemptsingested in the last 3 hours. - New
IPv4orFQDNsightings in CLL below 1000 in the last 24 hours. - No new OpenCTI IOCs ingested in the last 12 hours.
- No new RSS reports ingested in the last 6 hours.